Introduction
This project, completed as part of a college course in Development Economics (ECON05C12), explores the relationship between economic growth, income inequality, and poverty reduction across 77 countries from 1980 to 2020. Using data from the World Bank’s World Development Indicators and the Poverty and Inequality Platform, we analyze income mobility, growth incidence curves, and the effectiveness of economic growth in reducing poverty. The study incorporates methodologies such as Dollar-Kraay regressions, the Kuznets Curve hypothesis, and Growth Incidence Curves (GICs) to provide insights into the inclusivity of growth and its impact on disadvantaged populations.
Motivation
Economic growth is often celebrated as a mechanism for poverty reduction, but its benefits are not evenly distributed. This project aims to challenge traditional narratives in development economics by focusing on a diverse sample of countries, including underrepresented low- and middle-income nations. By examining income mobility, inequality, and poverty, we hope to contribute to the discourse on equitable growth strategies and highlight the importance of inclusive development for sustainable progress.
Key Questions
- How does economic growth affect income mobility across different income groups and regions?
- What is the relationship between economic growth and poverty reduction, particularly for the poorest segments of the population?
- Does the Kuznets Curve hypothesis hold true for a diverse sample of countries?
- How do regional and structural factors influence the inclusivity of economic growth?
Note: While the project addressed all these questions, my contributions focused on country selection, Growth Incidence Curves, the global Kuznets Curve, and Dollar-Kraay regressions.
Methodology
Data Sources
- World Bank World Development Indicators: Used for GDP per capita, income classifications, and poverty metrics.
- World Bank Poverty and Inequality Platform: Provided data on inequality (Gini coefficients) and poverty measures (Headcount Ratio, Watt’s Index).
- United Nations World Income Inequality Database: Supplemented with additional and more frequent data on income distributions.
Analytical Techniques
-
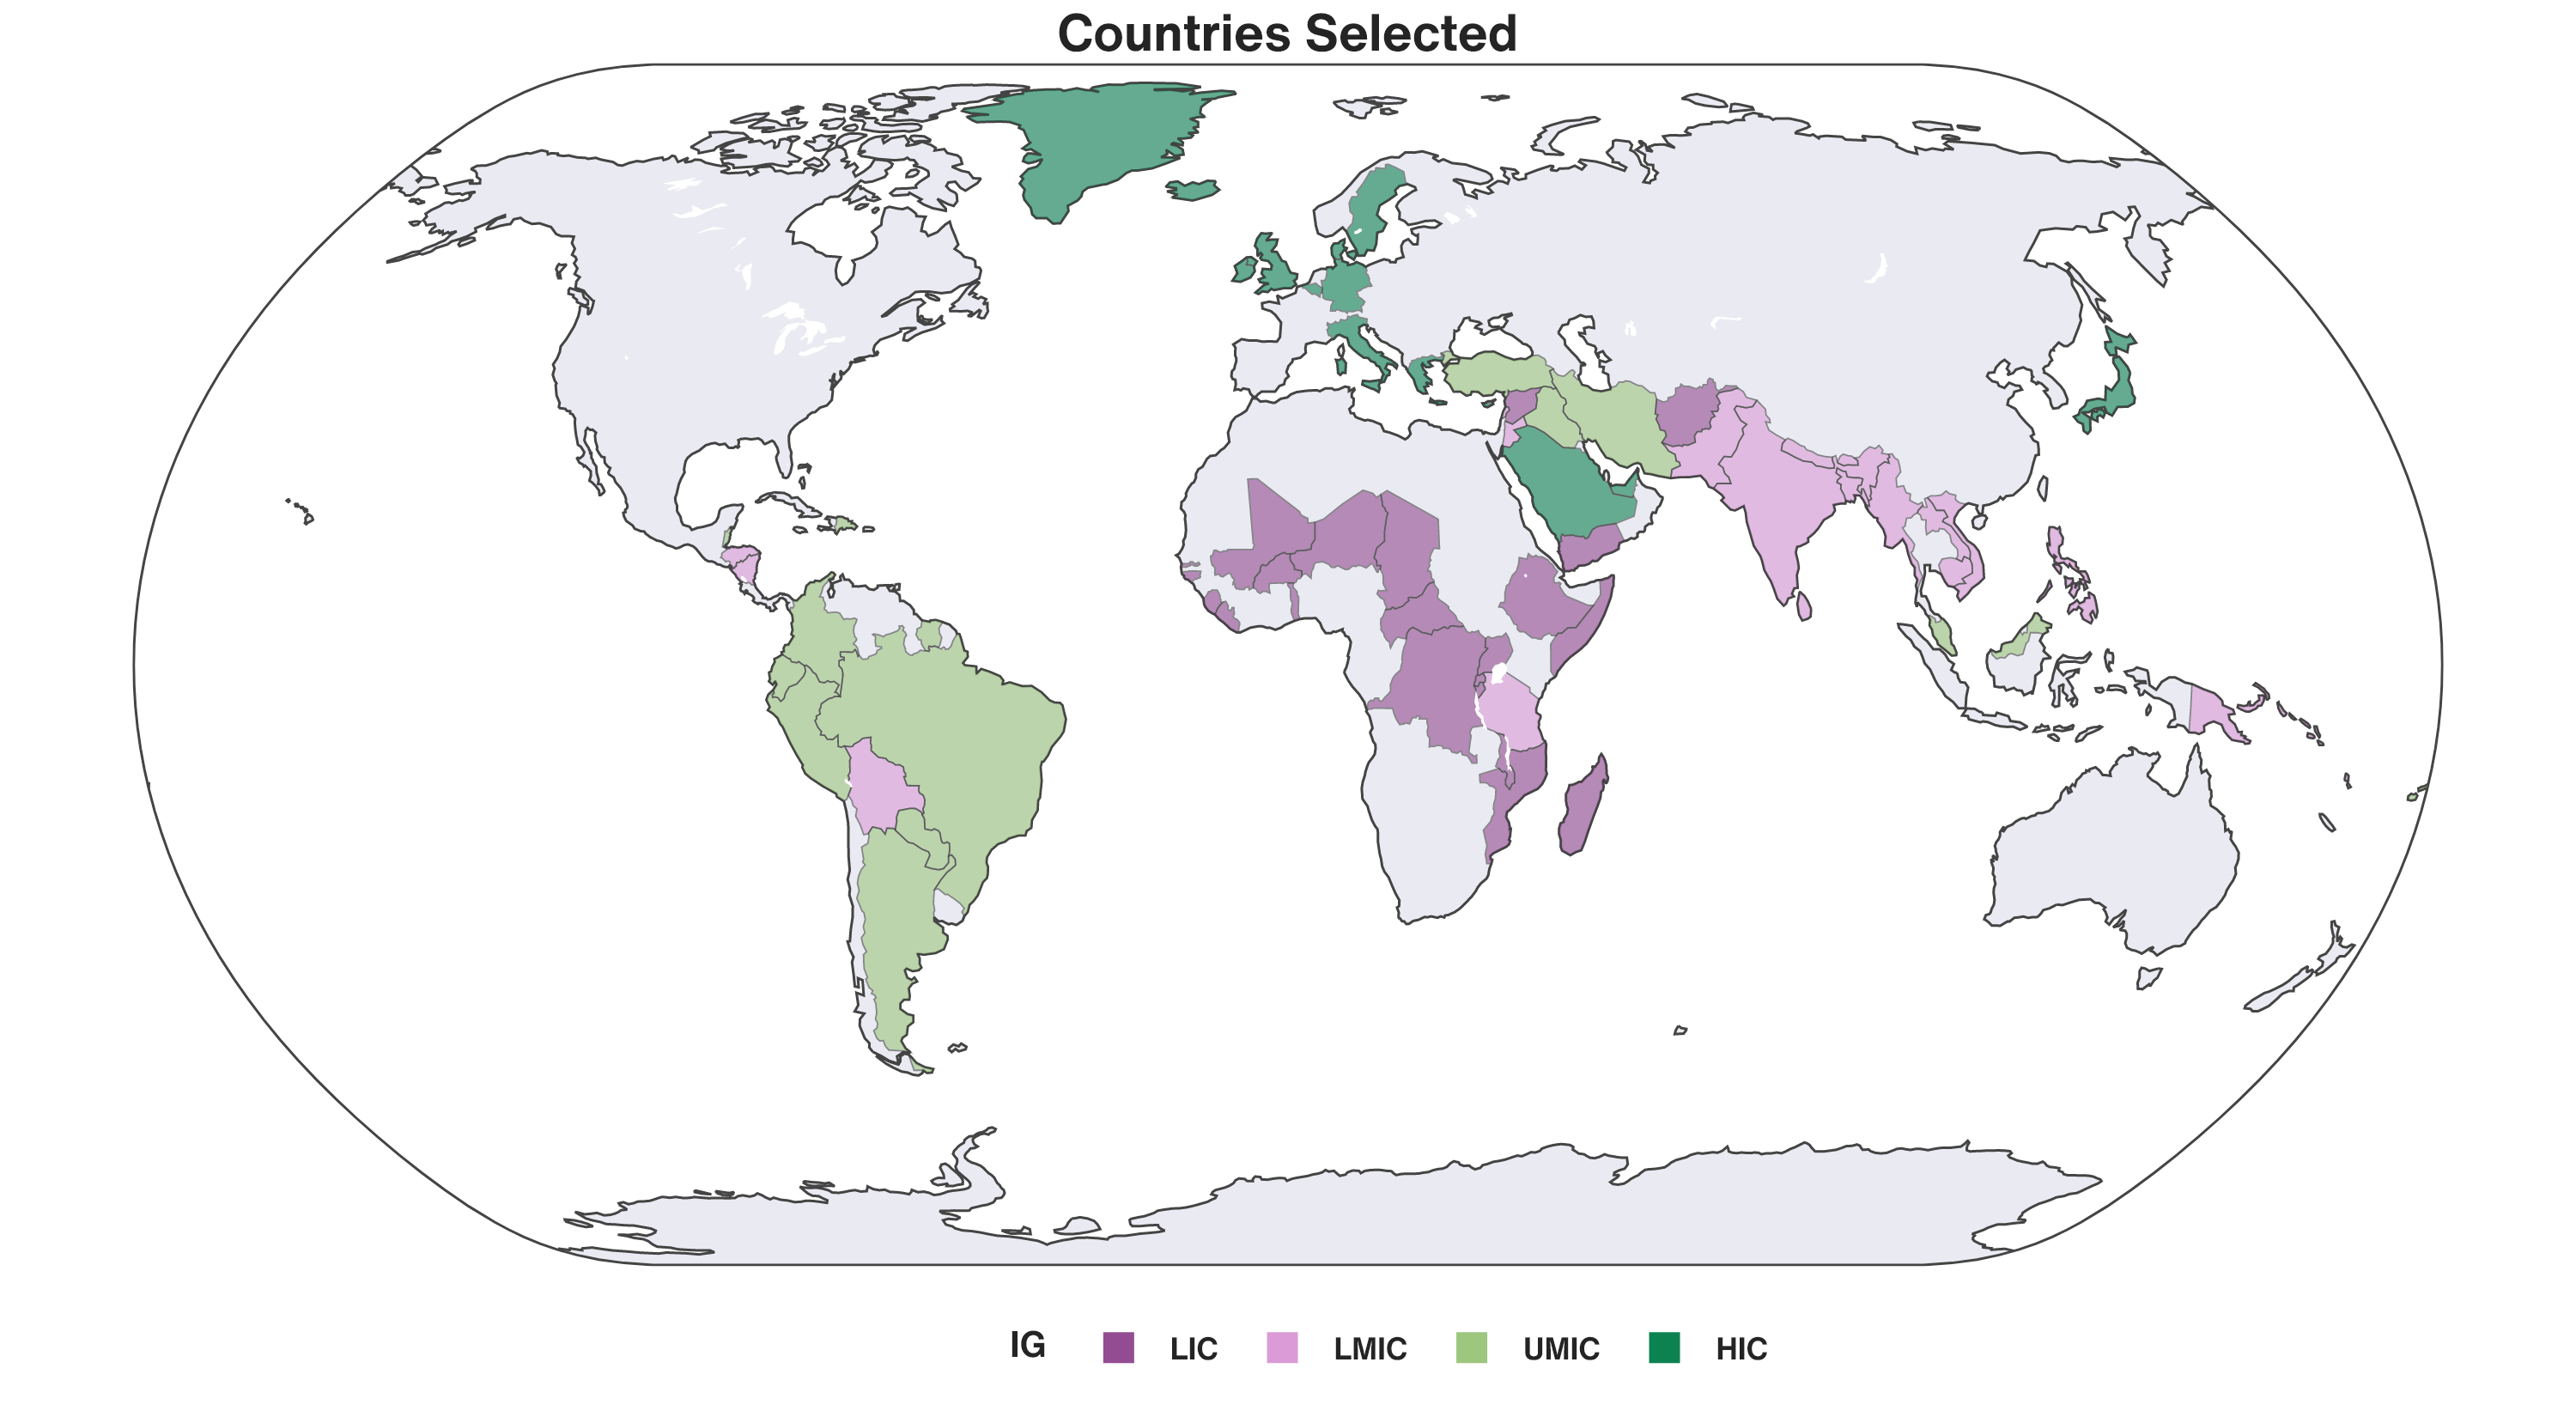
Country Selection:
- Compiled a list of 160 feasible countries based on data availability.
- Used integer programming to select 77 countries based on income groups and regions, ensuring economic and geographic diversity.
- The selection criteria included:
- Income Groups: 21 low-income, 22 lower-middle-income, 18 upper-middle-income, and 16 high-income countries.
- Regions: 25 Asian, 19 African, 12 European, 6 North American, 8 South American, and 7 Oceanian nations.
- The goal was to ensure a representative sample of countries while maintaining data availability and consistency.
-
Growth Incidence Curves (GICs):
- The GIC was constructed by ranking all feasible countries from lowest to highest GDP per capita for the years 1980 and 2020.
- Used the ranks of countries and their corresponding incomes as an analogue to the percentile-wise incomes.
- The growth rate of GDP per capita for each rank was then calculated and plotted against the income ranks.
-
Kuznets Curve (Park & Brat Methodology):
- Adapted Park & Brat’s (1995) methodology to compute a global variant of the Kuznets Curve, treating each country as an individual in the global income distribution.
- Calculated the mean per capita real GDP across all countries in 2017 PPP USD terms and normalized each country’s GDP by dividing it by the annual global mean.
- Derived the Gini coefficient by calculating twice the covariance between normalized ranks and standardized income levels (Lerman & Yitzhaki, 1985).
-
Dollar-Kraay Regressions:
- Tested the relationship between average incomes and the incomes of the poorest quintile and decile, and whether growth is ‘pro-poor’
- Performed robustness checks by incorporating policy variables such as government expenditure on healthcare, education, trade openness, and urbanisation.
-
Data Visualization:
- Created visualisations (e.g., world maps, scatter plots) to communicate findings effectively.
Key Findings
Country Selection
- The integer programming model successfully selected a diverse and representative sample of 77 countries, ensuring balanced representation across income groups and regions.
- This approach allowed for a comprehensive analysis of development trajectories, highlighting challenges faced by low- and middle-income nations.
Growth Incidence Curves (GICs)
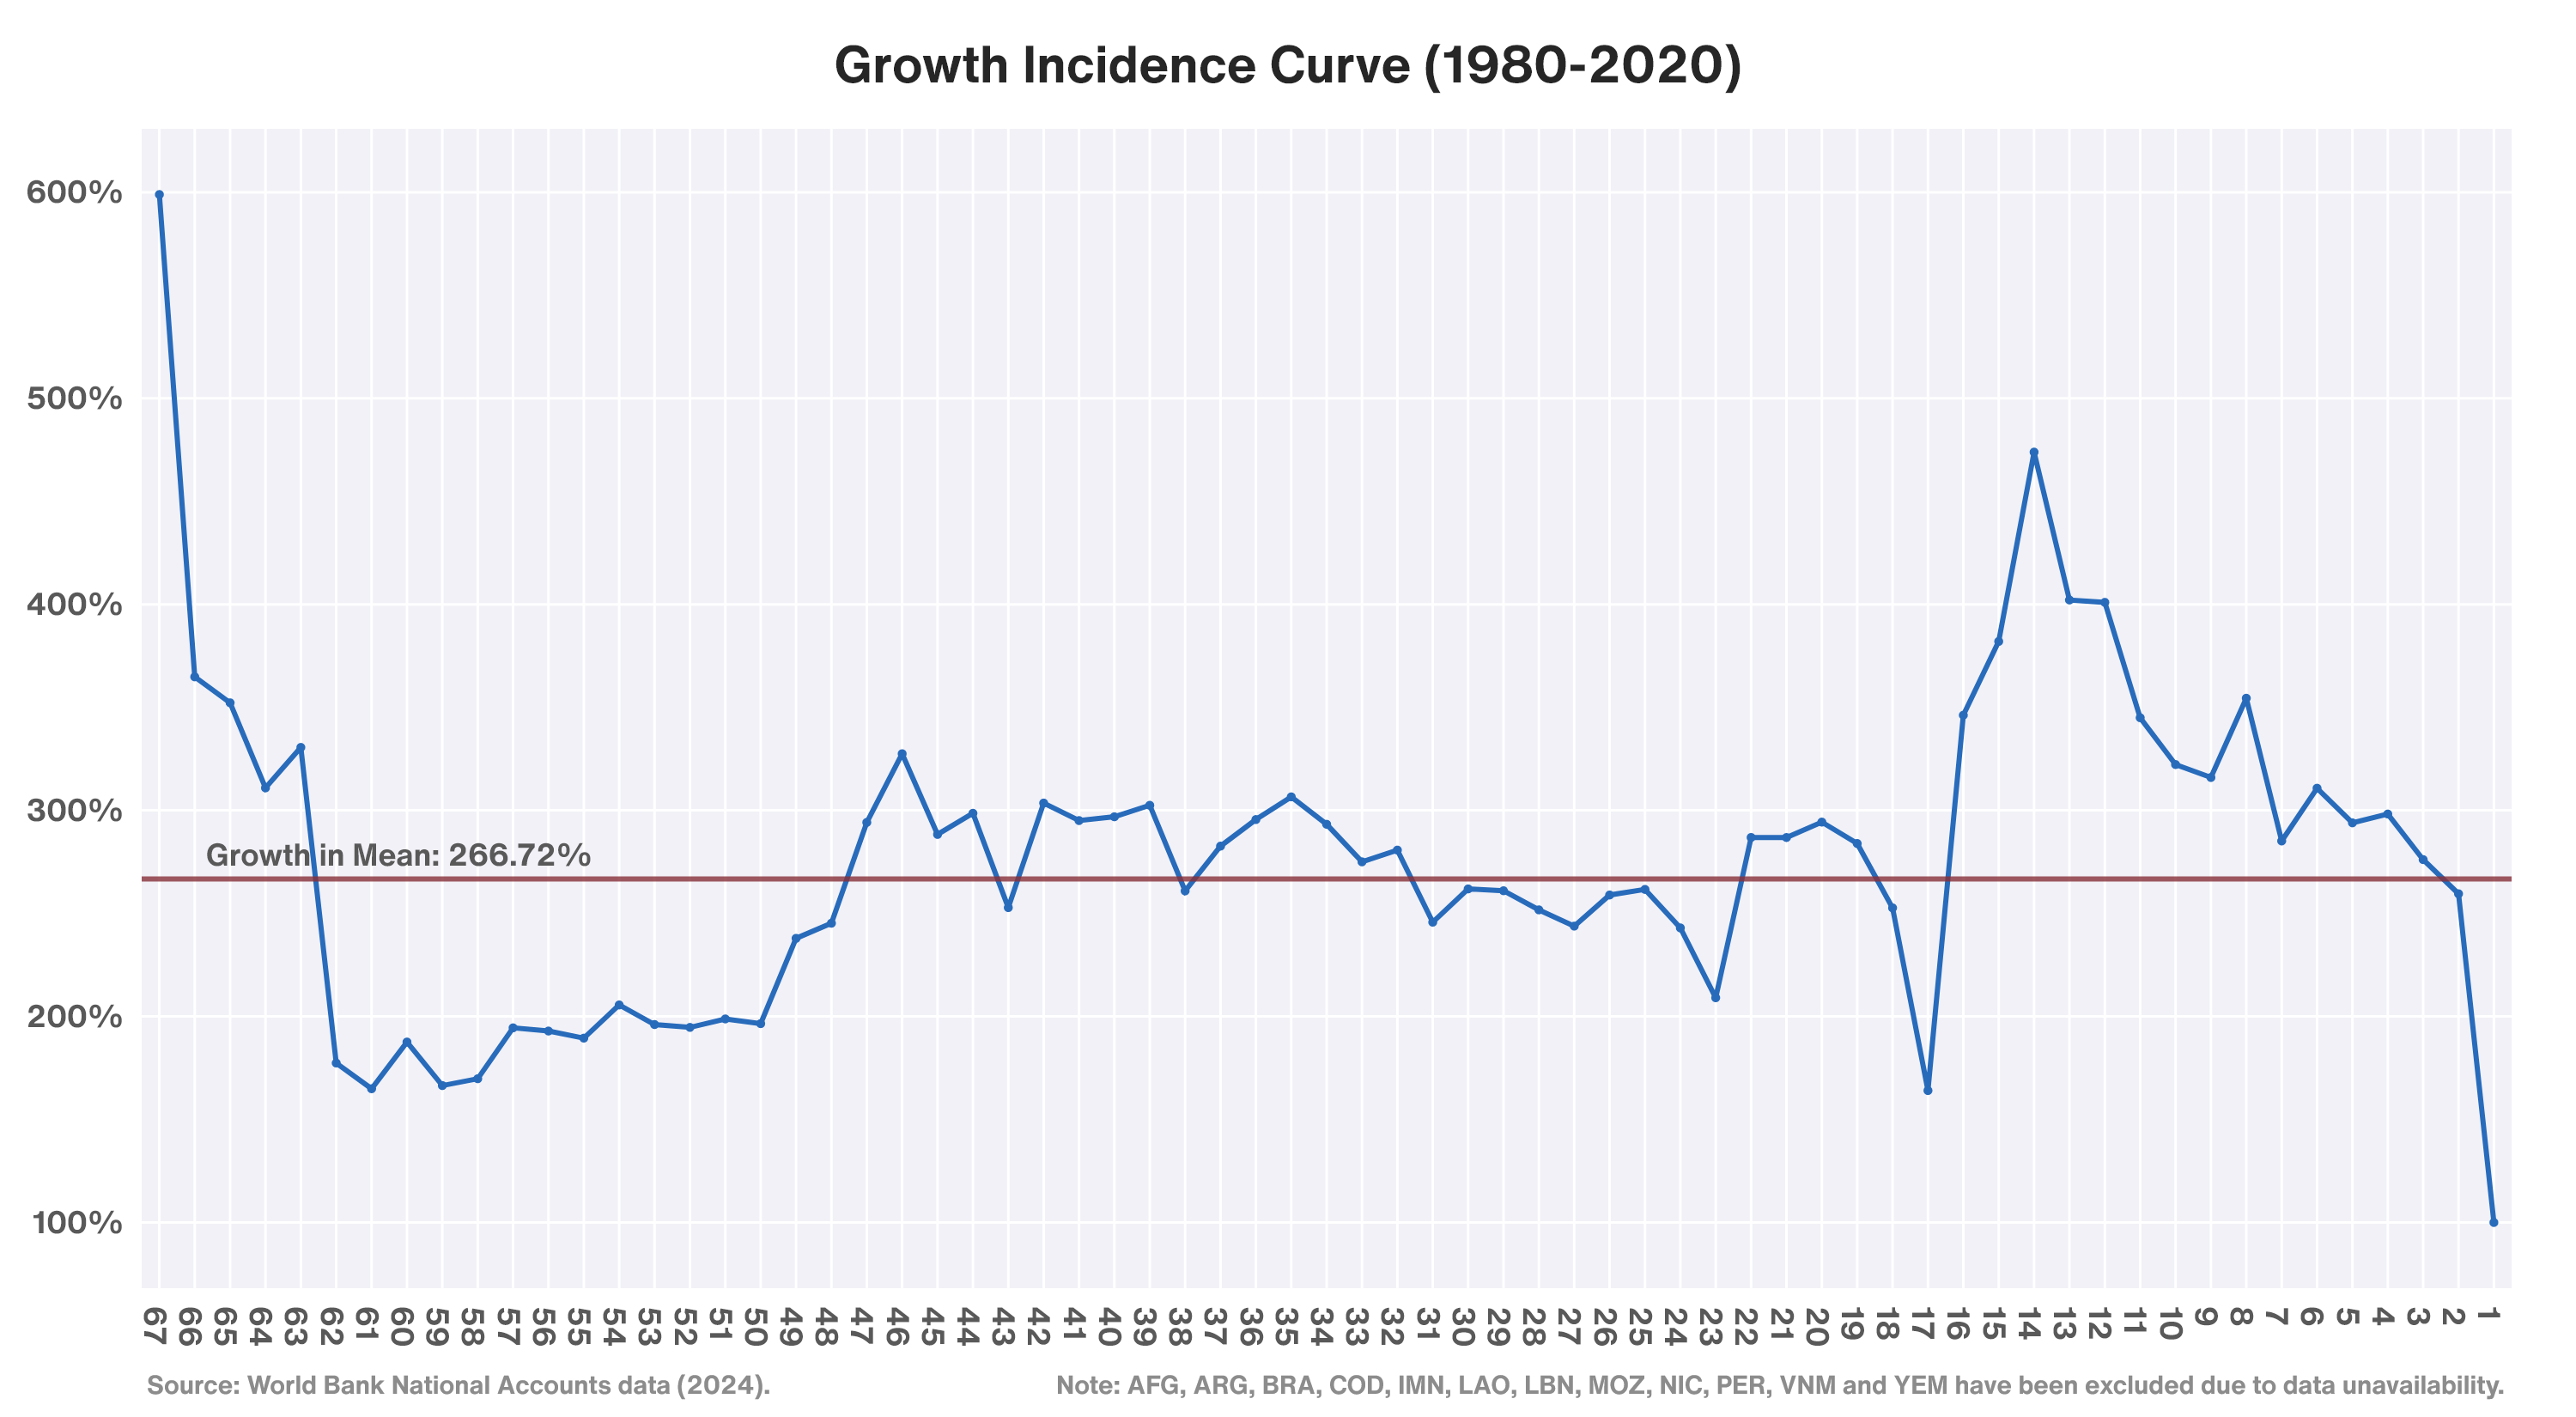
- Lower-income countries experienced significant percentage growth in GDP per capita, driven by their low initial income base. For example, some countries saw growth rates of up to 600% over the 1980-2020 period.
- Middle-income countries grew at rates close to the global average, while high-income countries showed slower growth, with some even experiencing declines in the highest income brackets.
- The period 2000-2020 showed stronger pro-poor growth compared to 1980-2000, likely due to reduced global political tensions and increased economic liberalisation.
Kuznets Curve
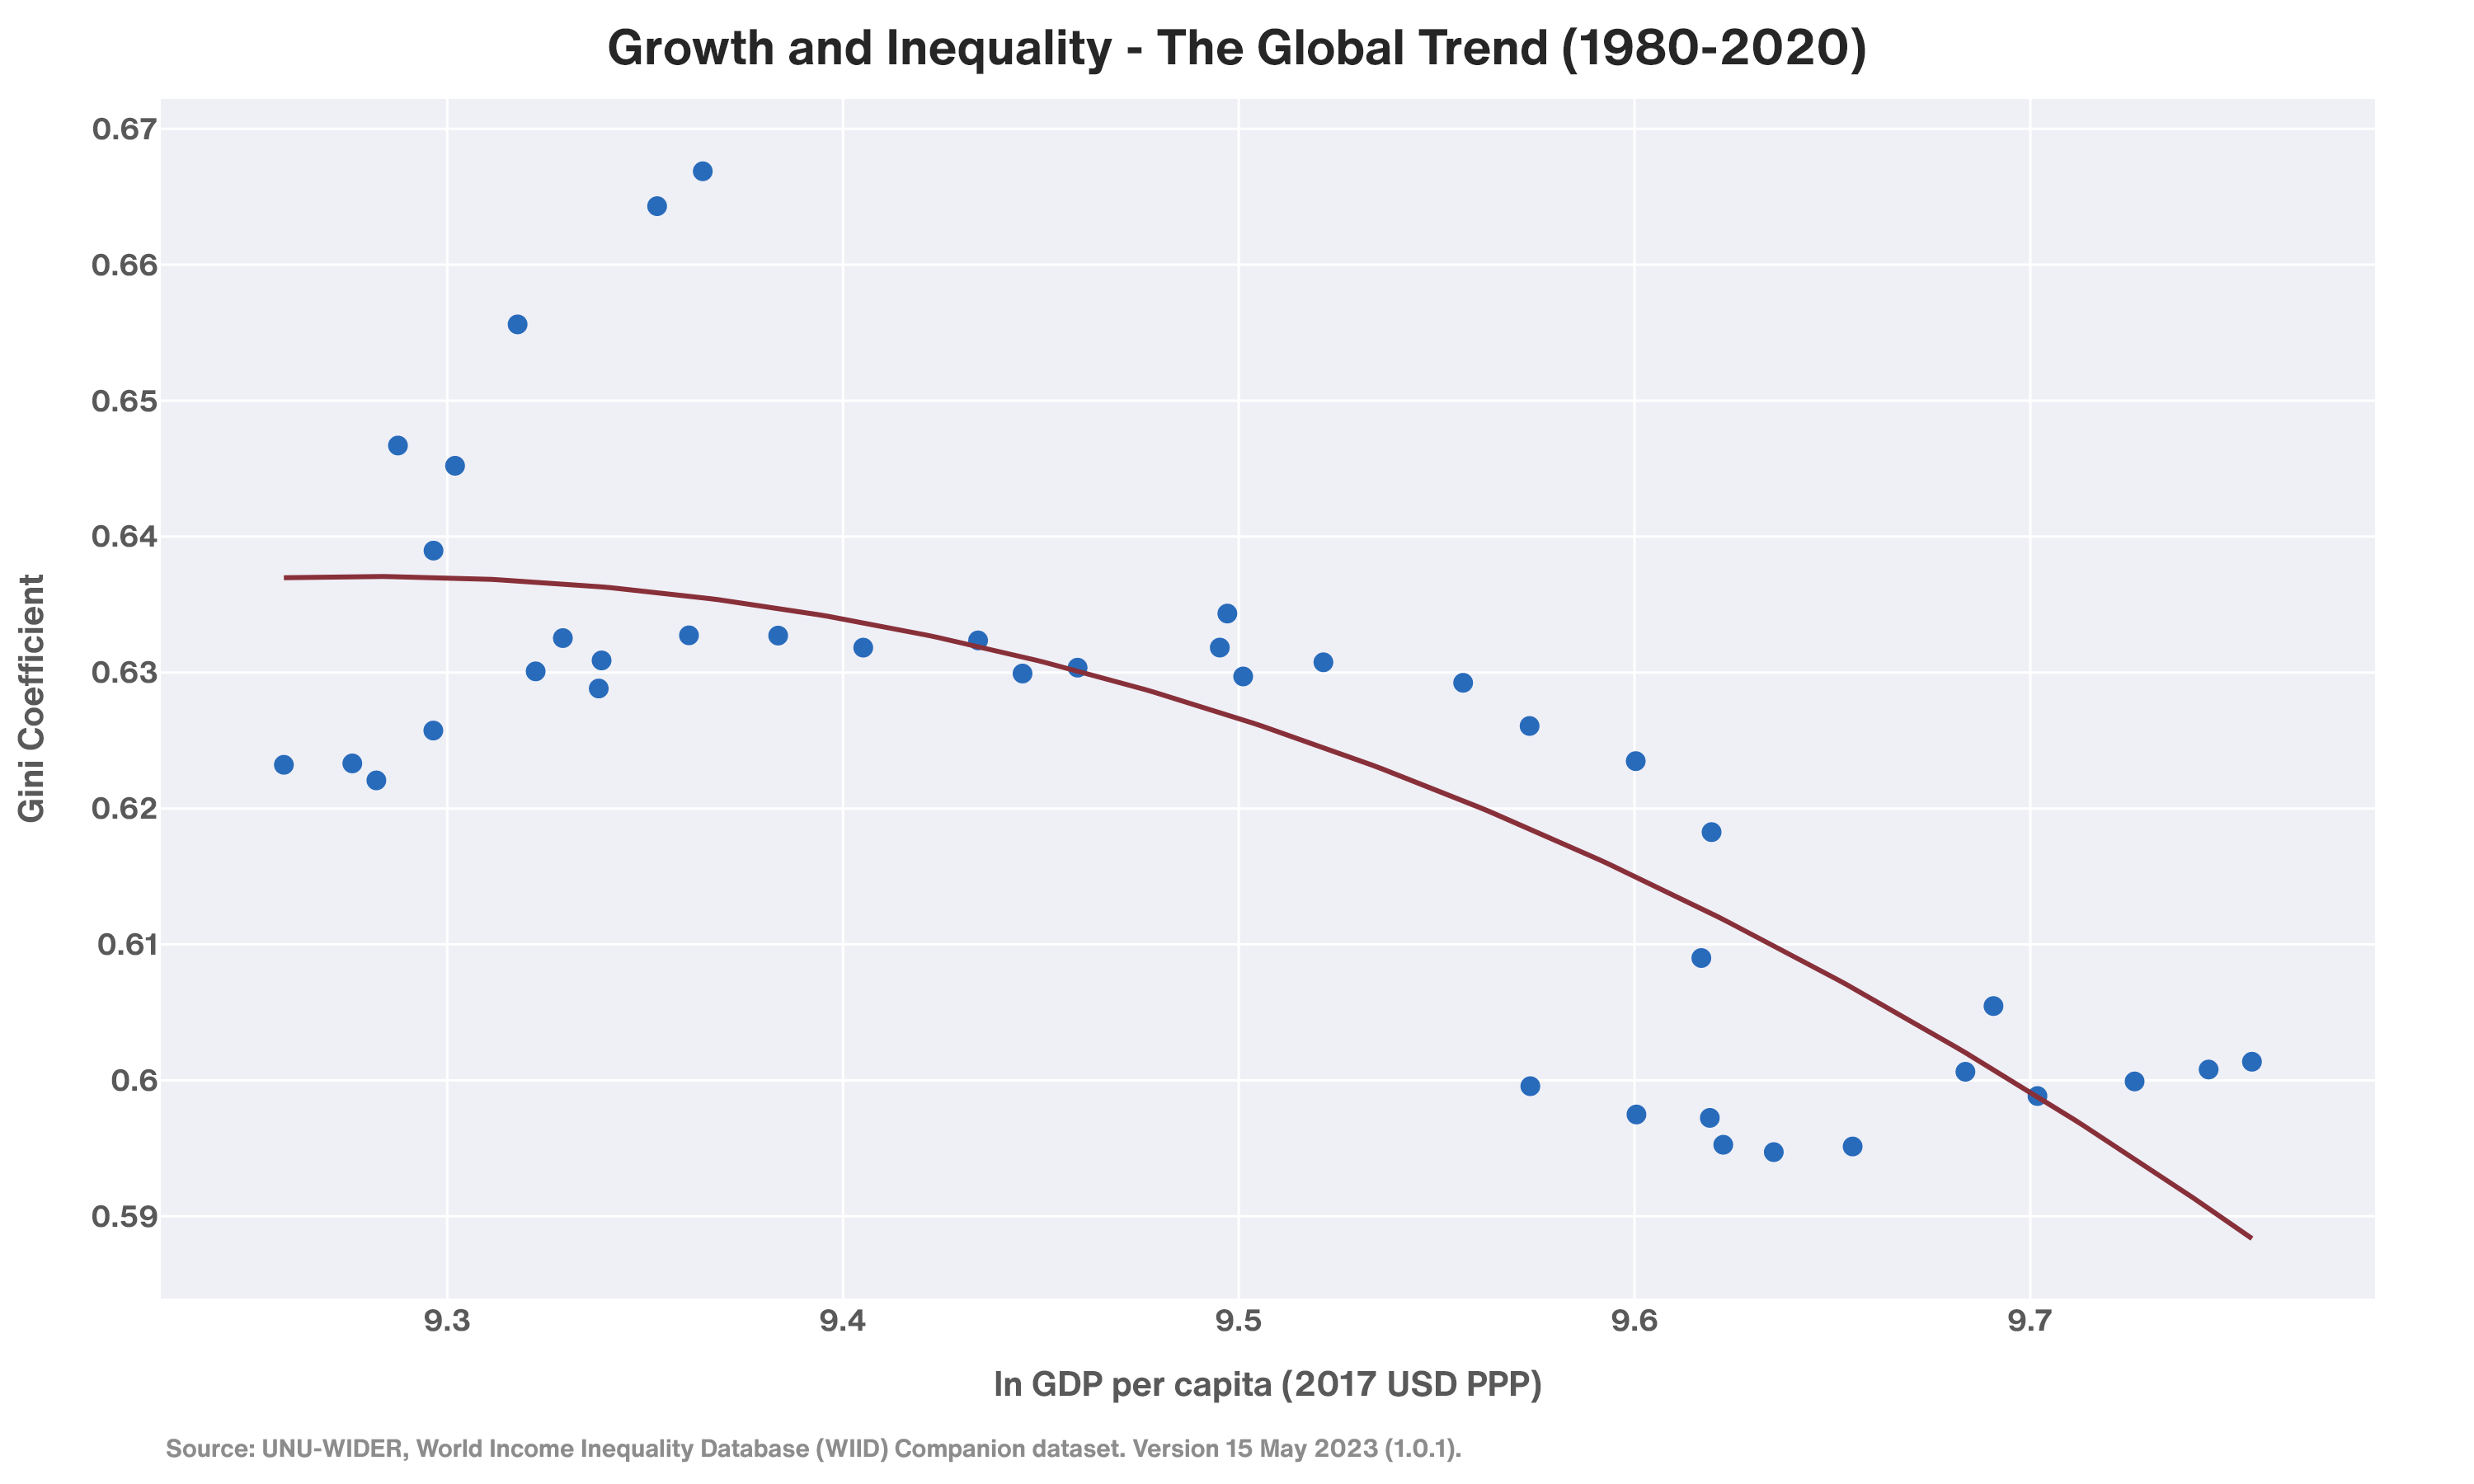
- The global Gini series showed a consistent downward trend from 1980 to 2020, suggesting income convergence between richer and poorer nations.
- The decline in global inequality reflects the rapid growth of emerging economies, particularly in Asia, which has narrowed the income gap with high-income nations. However, the existence of outliers suggest that this convergence has been uneven, with some regions (e.g., Sub-Saharan Africa) lagging behind.
Dollar-Kraay Regressions
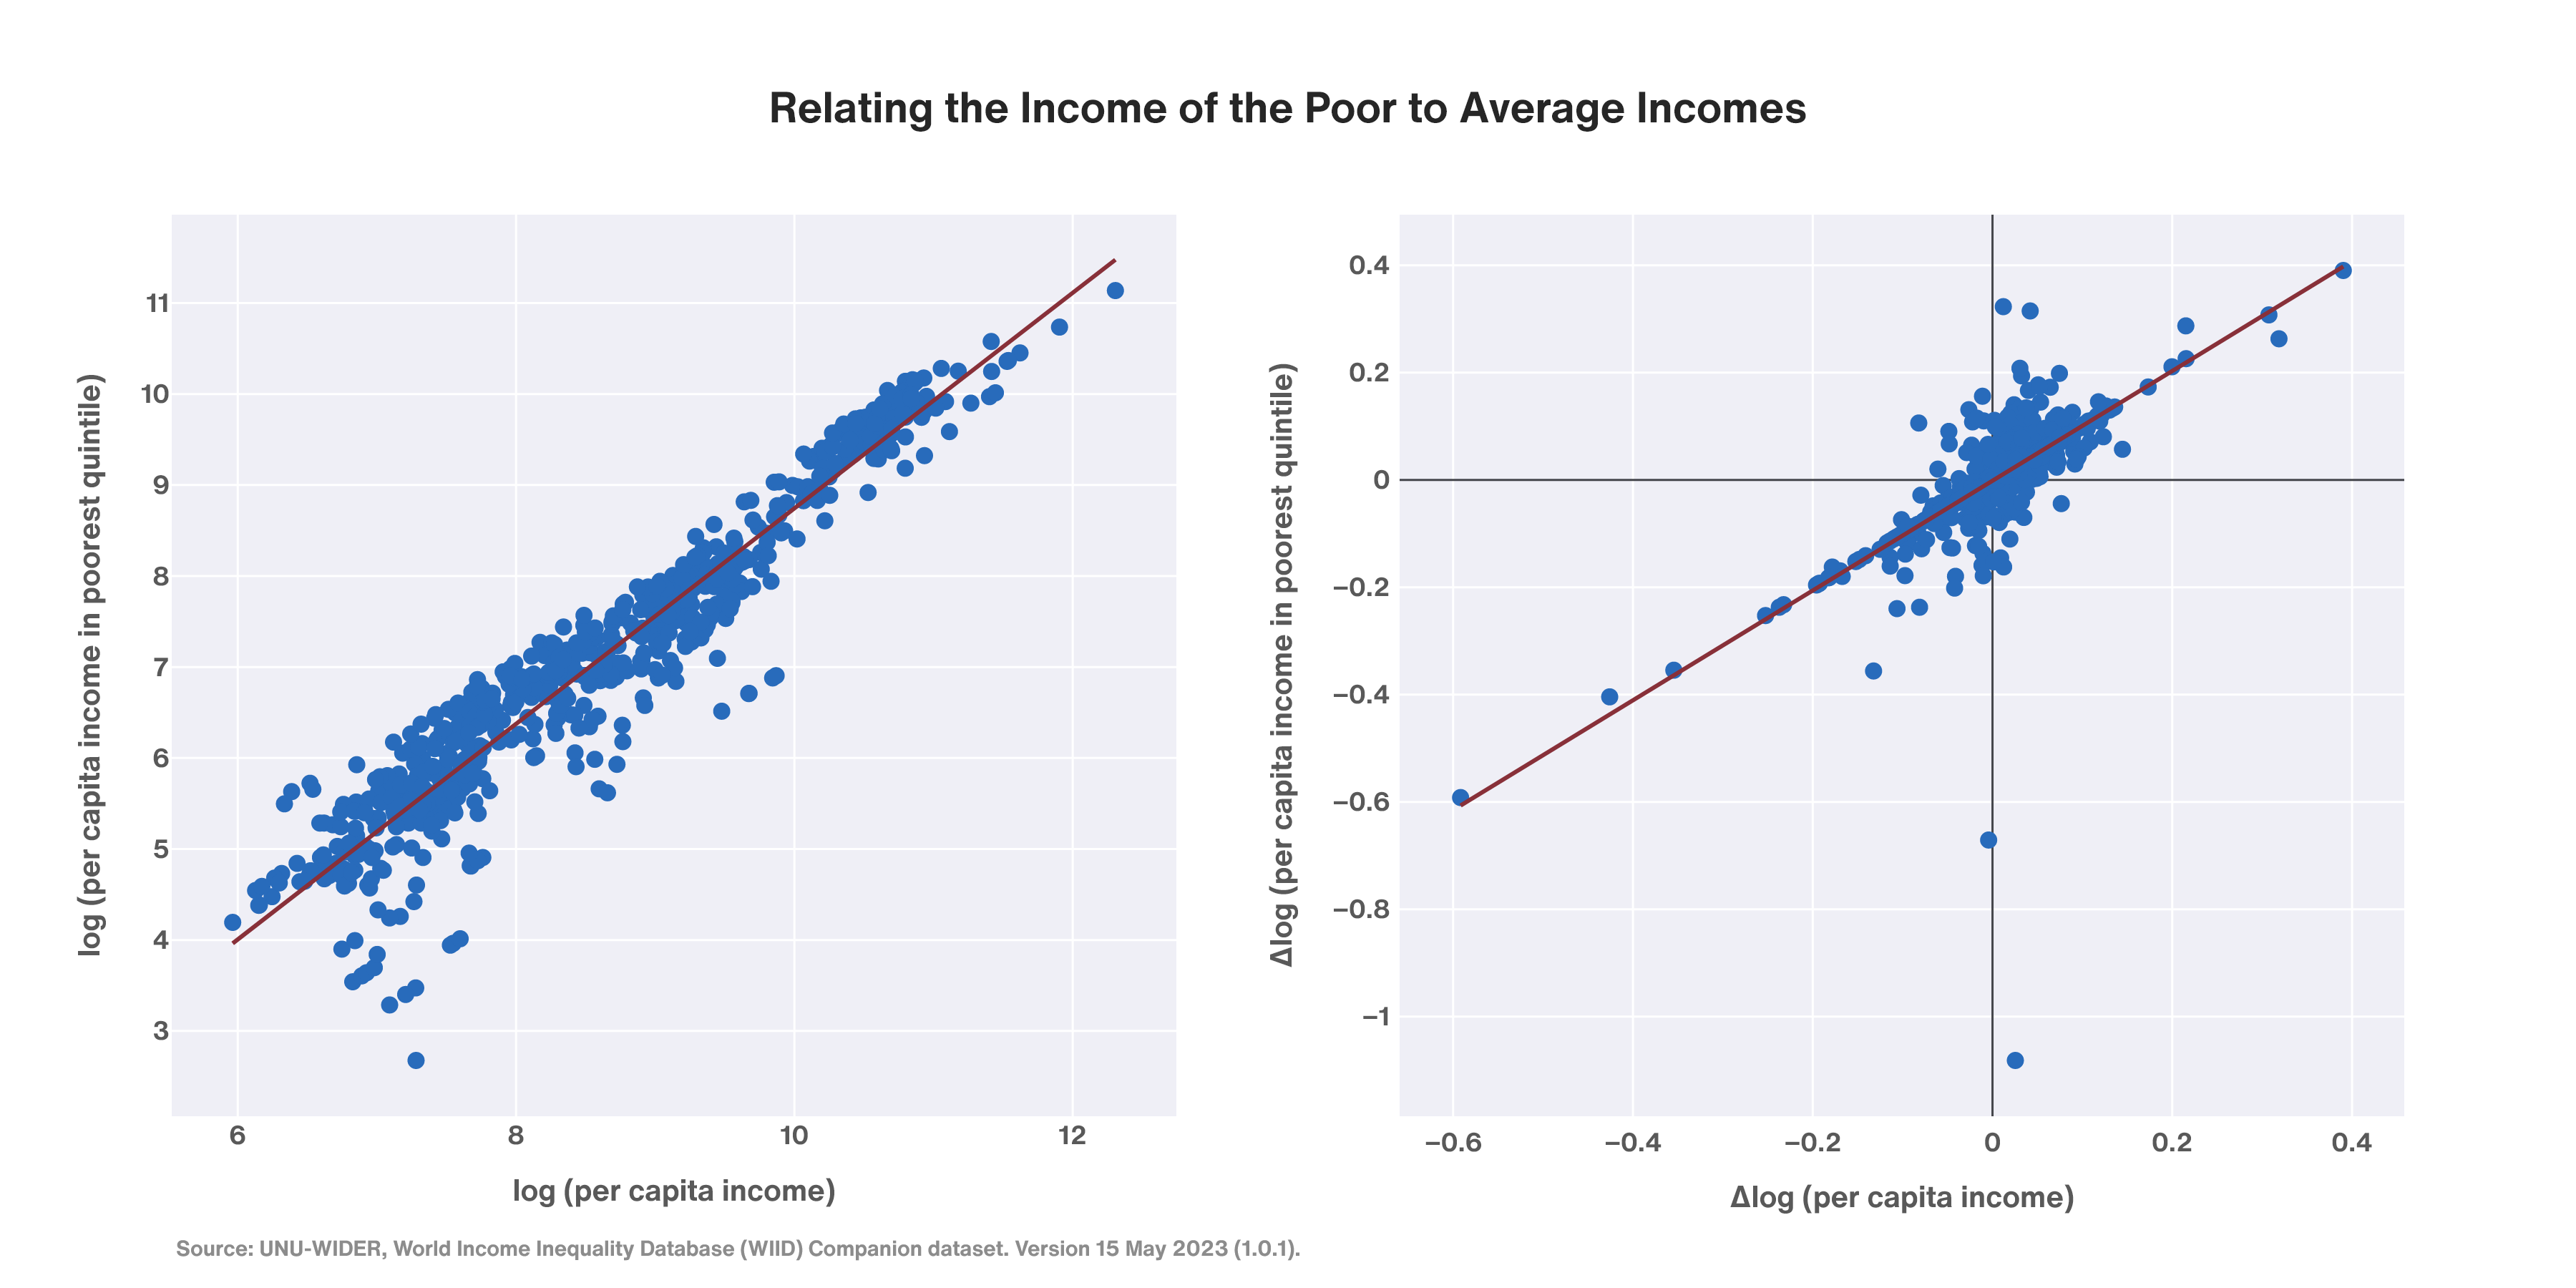
- Economic growth positively impacted the incomes of the poorest quintile and decile, with slope coefficients close to 1, indicating proportional income gains for the poor.
- Robustness checks revealed that factors such as government expenditure on healthcare and education positively influenced low-income productivity, while higher inequality (Gini coefficient) restricted wealth distribution to the poor.
- The relationship between growth and the incomes of the poor was weaker in Africa compared to other regions, highlighting structural challenges in translating growth into poverty reduction.
Data-Driven Insights
- The analysis highlighted the importance of inclusive growth policies, particularly for low- and middle-income countries, where structural barriers and uneven globalisation often limit the benefits of economic growth.
- Visualisations such as world maps and scatter plots effectively communicated the distribution of economic growth and inequality, providing actionable insights for policymakers.
Technologies Used
- Python: For data analysis, integer programming, and visualisation.
- pandas & Polars: For data manipulation and analysis (pandas for medium datasets, and Polars for larger datasets).
- plotly: For creating interactive and static data visualizations.
- statsmodels: For linear regression analysis.
- PuLP: For formulating and solving the integer programming problem for country selection.
- Jupyter Notebooks: For documenting and sharing the analysis.
Full Report
The full report was submitted to our professor as part of the course requirements. While it is not included in this repository, the code and methodologies used for my contributions are fully documented here.